For each project Where Consulting have taken time to fully understand our requirements. They have helped us differentiate ourselves from our competitors with mapping that is both visually engaging and useful to our clients, helping us to secure repeat business and attract new clients. Richard Hooper - Associate Director at Opinion Research Business.
Services
Rigorous spatial analysis underpins all projects. This may involve data cleansing, geocoding, geostatistical techniques, interpolation and autocorrelation analysis. The deliverables may be static content to present findings, or interactive tools to explore trends.
Geoanalytics for reports
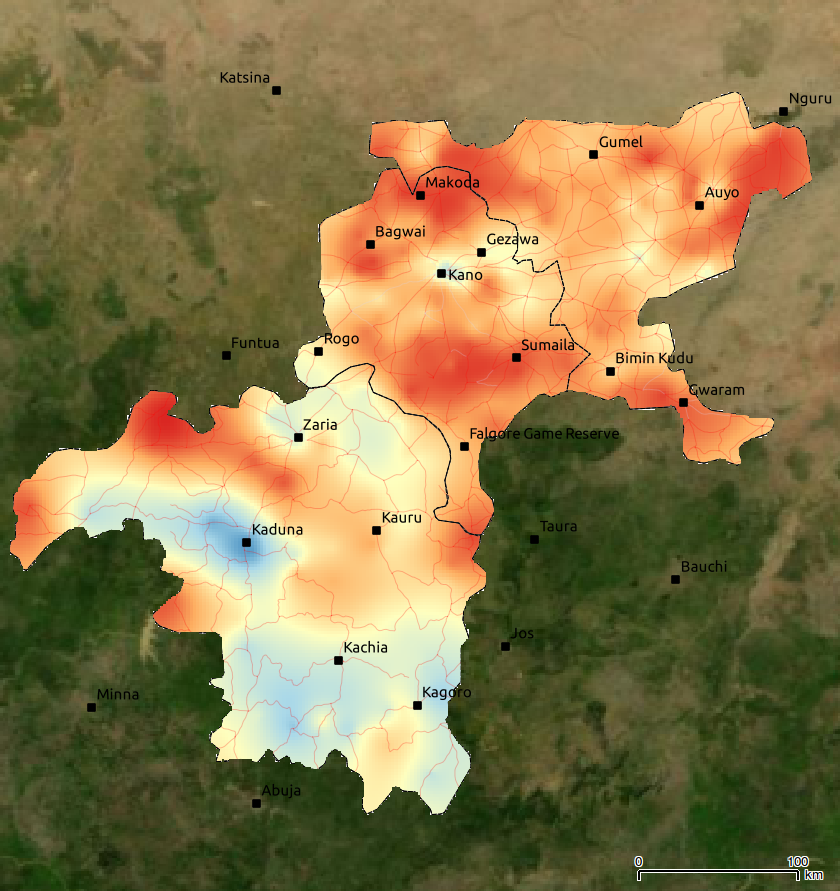
Often, static images and charts are required to augment reports: a map can be worth a thousand words. On the right are two such examples of static output used in a study of the impact of a Nigerian initiative to increase availability of family planning services, based on a survey of 10,000 households.
The map shows clear spatial variation: red represents less availability of family planning services, and blue greater availability. The chart shows that the closer you are to surgeries, the more likely you are to be offered family planning services.

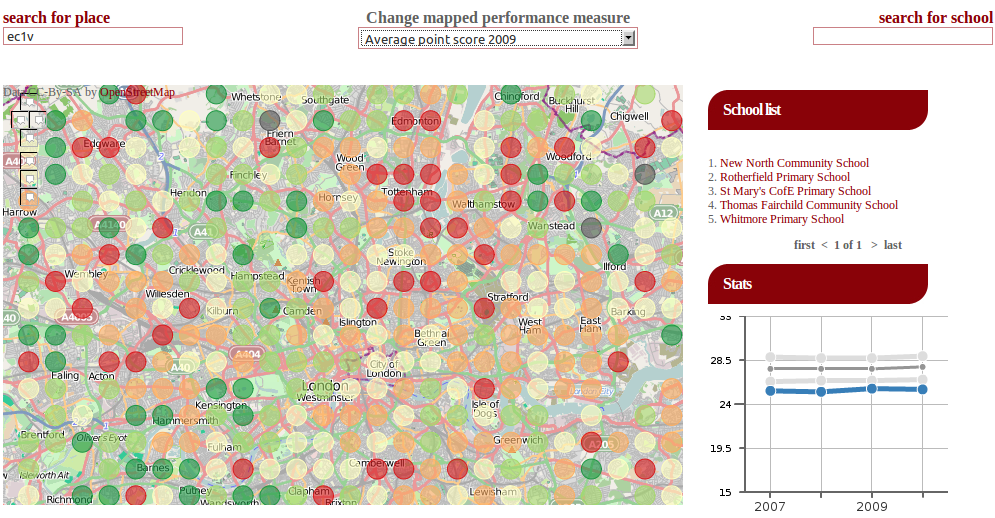
Web mapping
Online web mapping applications provider simple, accessible tools for people to explore the trends within data. The images on the right are taken from two such web applications: one showing variation in school performance in the UK, the other spatial variation in deaths during the Iraq War.
Check out the Political Opinion Map of voting intentions in Scotland created for Lord Ashcroft Polls as an example.
If you'd like to know more, then we'd love to hear from you - please feel free to contact us, without obligation.